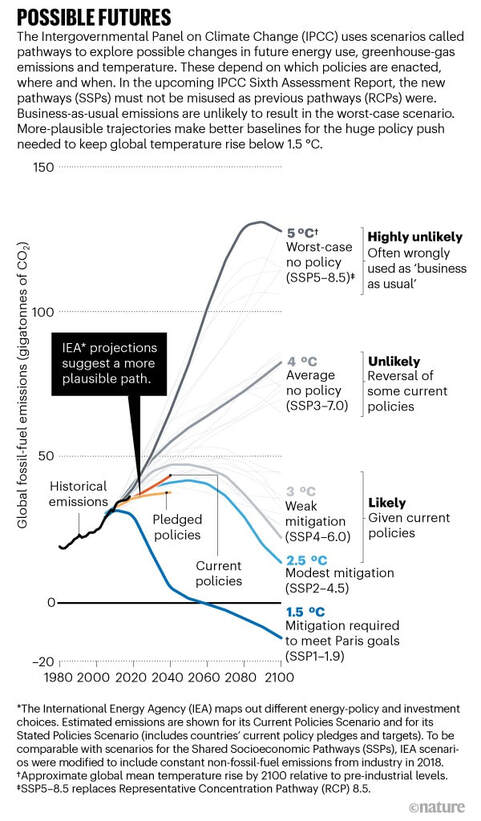
 from Hausfather & Peters (2020) - https://www.nature.com/articles/d41586-020-00177-3 Holidays are over , days are getting shorter (not really cooler yet) and I am back in the office trying to get some papers finished off and sent out. One of them is a modelling - based work looking at thermal stress of heatwaves on mollusks in the Venice lagoon . We took the tolerance landscape approach (where stress is determined by both duration and intensity of the stressor, in this case temperature) and are forcing it with temperature scenarios for the next century. A common way to do this is use a ‘plausible’ scenario (e.g. the RCP 4.5) and then the ‘worst case’ , also called the ‘business as usual’ RCP 8.5 (you can read more on the IPCC reports). This has been the case since my early days in climate change research , when I was working with ocean acidification studies. There are some controversies regarding the ‘business as usual’ name, as explained on this carbon brief article from 2019
In recent years the emissions scenario used to generate RCP8.5 has come under criticism by a number of researchers for its assumptions around high future emissions and a dramatic expansion of coal use.[…] According to the researchers who developed it, RCP8.5 was intended to be a “very high baseline emission scenario” representing the 90th percentile of no-policy baseline scenarios available at the time.The creators of RCP8.5 had not intended it to represent the most likely “business as usual” outcome, emphasising that “no likelihood or preference is attached” to any of the specific scenarios. Its subsequent use as such represents something of a breakdown in communication between energy systems modellers and the climate modelling community. However on this nature article at the beginning of 2020 we read Some researchers argue that RCP8.5 could be more likely than was originally proposed. This is because some important feedback effects — such as the release of greenhouse gases from thawing permafrost — might be much larger than has been estimated by current climate models. These researchers point out that current emissions are in line with such a worst-case scenario. Yet, in our view, reports of emissions over the past decade suggest that they are actually closer to those in the median scenarios. In the nature paper (which is 2 years old) the most likely paths seem to be the RCP 6 and RCP4.5 (see image at the top of the post) (read more on the controversies also on this climatenexus post) Then one may argue ‘why are we even using the 8.5 to look at the consequences?’ First of all i think because as scientists we are curious to know ‘what will happen if..’ , and looking at these extreme values may help understanding patterns Also, while it’s unlikely, it is still a scenario, and , as we should have learnt by now, things are not so straightforward as we initially think. There may be some cascading effects and so it’s better to be prepared and having done the homework to know what to expect. This said, I feel that while writing such papers should be emphasising the unlikelihood of the scenario , and describe it as a worst case / extreme . And we should look more into the RCP 4.5 and RCP 6. May not make for a big title or a top story, as results may be somewhere in the middle. And that's maybe another reason why the 8.5 is used so much, and a times in a highly misleading way. And this is not to say that RCP 4.5 and 6 are not bad.. We are already experiencing some climate change effects. But they are messy, and not necessarily so linear as we may expect. You will for sure see me trying to use the lower scenarios, and if not, justify very well the choice of the 8.5..
0 Comments
Leave a Reply. |
Disclaimer: some posts may contain affiliate links. At no extra costs to you, buying through the link will help me in this blogging journey!
Archives
January 2023
Categories
All
|
 RSS Feed
Photos used under Creative Commons from doustpauline of > \whatwhenwhere/ <all behind., R'lyeh Imaging, Casey Hugelfink, Eric Tessmer, Honolulu Hawaii, marcoverch, shixart1985, Pascal Volk, ericcooper3, shixart1985, Rennett Stowe, romanboed, Free Public Domain Illustrations by rawpixel, Double--M, shixart1985, Ewan-M, focusonmore.com, Bennilover, dsgetch
